2023 is now behind us, and it is time to conclude the year and look into 2024. After a strong year-end stock market rally following declining interest rates and expectations of massive cuts by the central banks in 2024, the rally has primarily been observed across the larger software companies. Across approx. 80 US-listed SaaS companies, the median return was +40% in 2023 (source: Clouded Judgement). However, this positive momentum has not been seen across the Danish SaaS sector yet, as the median return was -20% in 2023 based on the current listings (note that good performers such as SimCorp and Digizuite are not included, as these were acquired at a share price premium and relatively high valuation multiples). However, some analysts expect that the small- and mid-cap segment will rebound in 2024 with the increasing risk appetite and valuation gap to the larger companies. This could be positive for the Danish SaaS sector, primarily consisting of smaller and medium-sized companies, after hitting a median ARR multiple of 3.0x by the end of 2023 (vs. 6.9x ARR for the US SaaS sector by the end of November 2023 – the ARR multiple from The SaaS Capital Index for end December 2023 is not updated yet, but this number may have increased in December 2023). Lately, some stocks in the Danish SaaS sector may also have been under short-term pressure due to tax-loss harvesting.
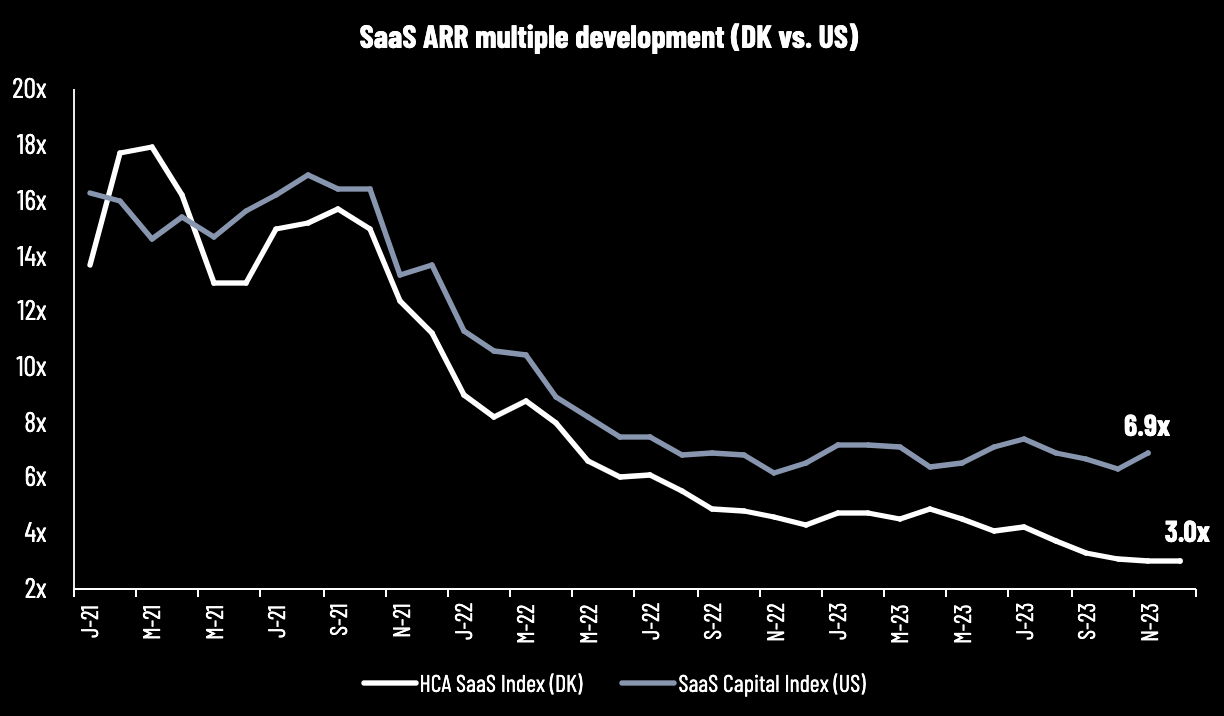
Source: HC Andersen Capital and The SaaS Capital Index
Recap of the Danish SaaS sector performance in 2023
Readers of this SaaS newsletter may ask why we haven’t seen a rebound in the Danish SaaS sector, and the median ARR multiple can be as low as 3.0x when the global/US SaaS sector trades at 6.9x ARR (November 2023). Explanations are many, but the most obvious ones are differences in size and share liquidity, as the global/US-listed companies are much bigger than the Danish companies. Another key explanation is the difference in balance sheets, as many Danish companies are less robust (compared to the US-listed SaaS companies) to the macroeconomic uncertainty, and some still are cash-burning due to their more early-stage nature. This may be the main reason for the Danish SaaS sector with a median return of -20% vs. the US SaaS sector with a median return of +40%.
Across the Danish SaaS sector, we have also seen that five stocks have declined more than 40% in 2023. A common characteristic across these companies is relatively large negative free cash flows, and most of the companies have raised capital at least one time during 2023.
In Denmark, the top performer this year has been OrderYOYO with a gain of 100%, which also is one of the top-performing stocks across the Danish stock market. The formula for OrderYOYO has been five guidance upgrades following a successful acquisition strategy as well as improving profitability.
As most companies release their annual report for 2023 and guidance for 2024 in February and/or March, it is too early to conclude the 2023 results and the outlook for the coming year. However, the median guidance for 2023 across the Danish SaaS sector is an ARR growth rate of 30% and an EBITDA of approx. DKK -6m (an improvement from approx. DKK -14m in 2022).
What to expect in the SaaS sector in 2024?
In our SaaS sector report from May 2023, the headline was “Have headwinds peaked?”, referring to both lower growth rates across the companies and the higher interest rate environment that harms growth stocks and the risk appetite. It was maybe a bit too early at that time, however, it seems like the global SaaS sector has somewhat bottomed out on the valuation multiples following declining interest rates, yet not on the growth rates, as the companies have adapted to the market environment and improved their profitability level and free cash flows significantly. Even though digitalization is a strong secular trend, some analysts discuss that median growth rates in the sector may continue to be lower than in the past years, as companies have invested in many software solutions, and B2B enterprise software is in a somewhat more mature phase than in 2020 before the pandemic. That said, a smaller reacceleration of growth rates could be on its way, as many companies have optimized their cost base, and new software solutions continue to arise and improve efficiency.
From an investor perspective, the main factor to look out for is still the development of the interest rates, which we have pointed out several times before. The recent development in the US 10Y bond yield, declining from approx. 5% to approx. 4% in a short time has been a very positive factor recently, which could increase the risk appetite and the flow into the smaller growth stocks. A changing factor that could demonstrate the increasing risk appetite would be an opening in the IPO market with new listings. On the other hand, a potential reacceleration of inflation rates could lead to higher interest rates again and change this positive scenario to a negative scenario.
Overview of key metrics for Danish SaaS companies
We have collected data from 14 listed Danish SaaS companies. The overview will be updated on an ongoing basis. Market capitalizations are latest updated on 29 December 2023. Read the note below the tables for more detailed information.
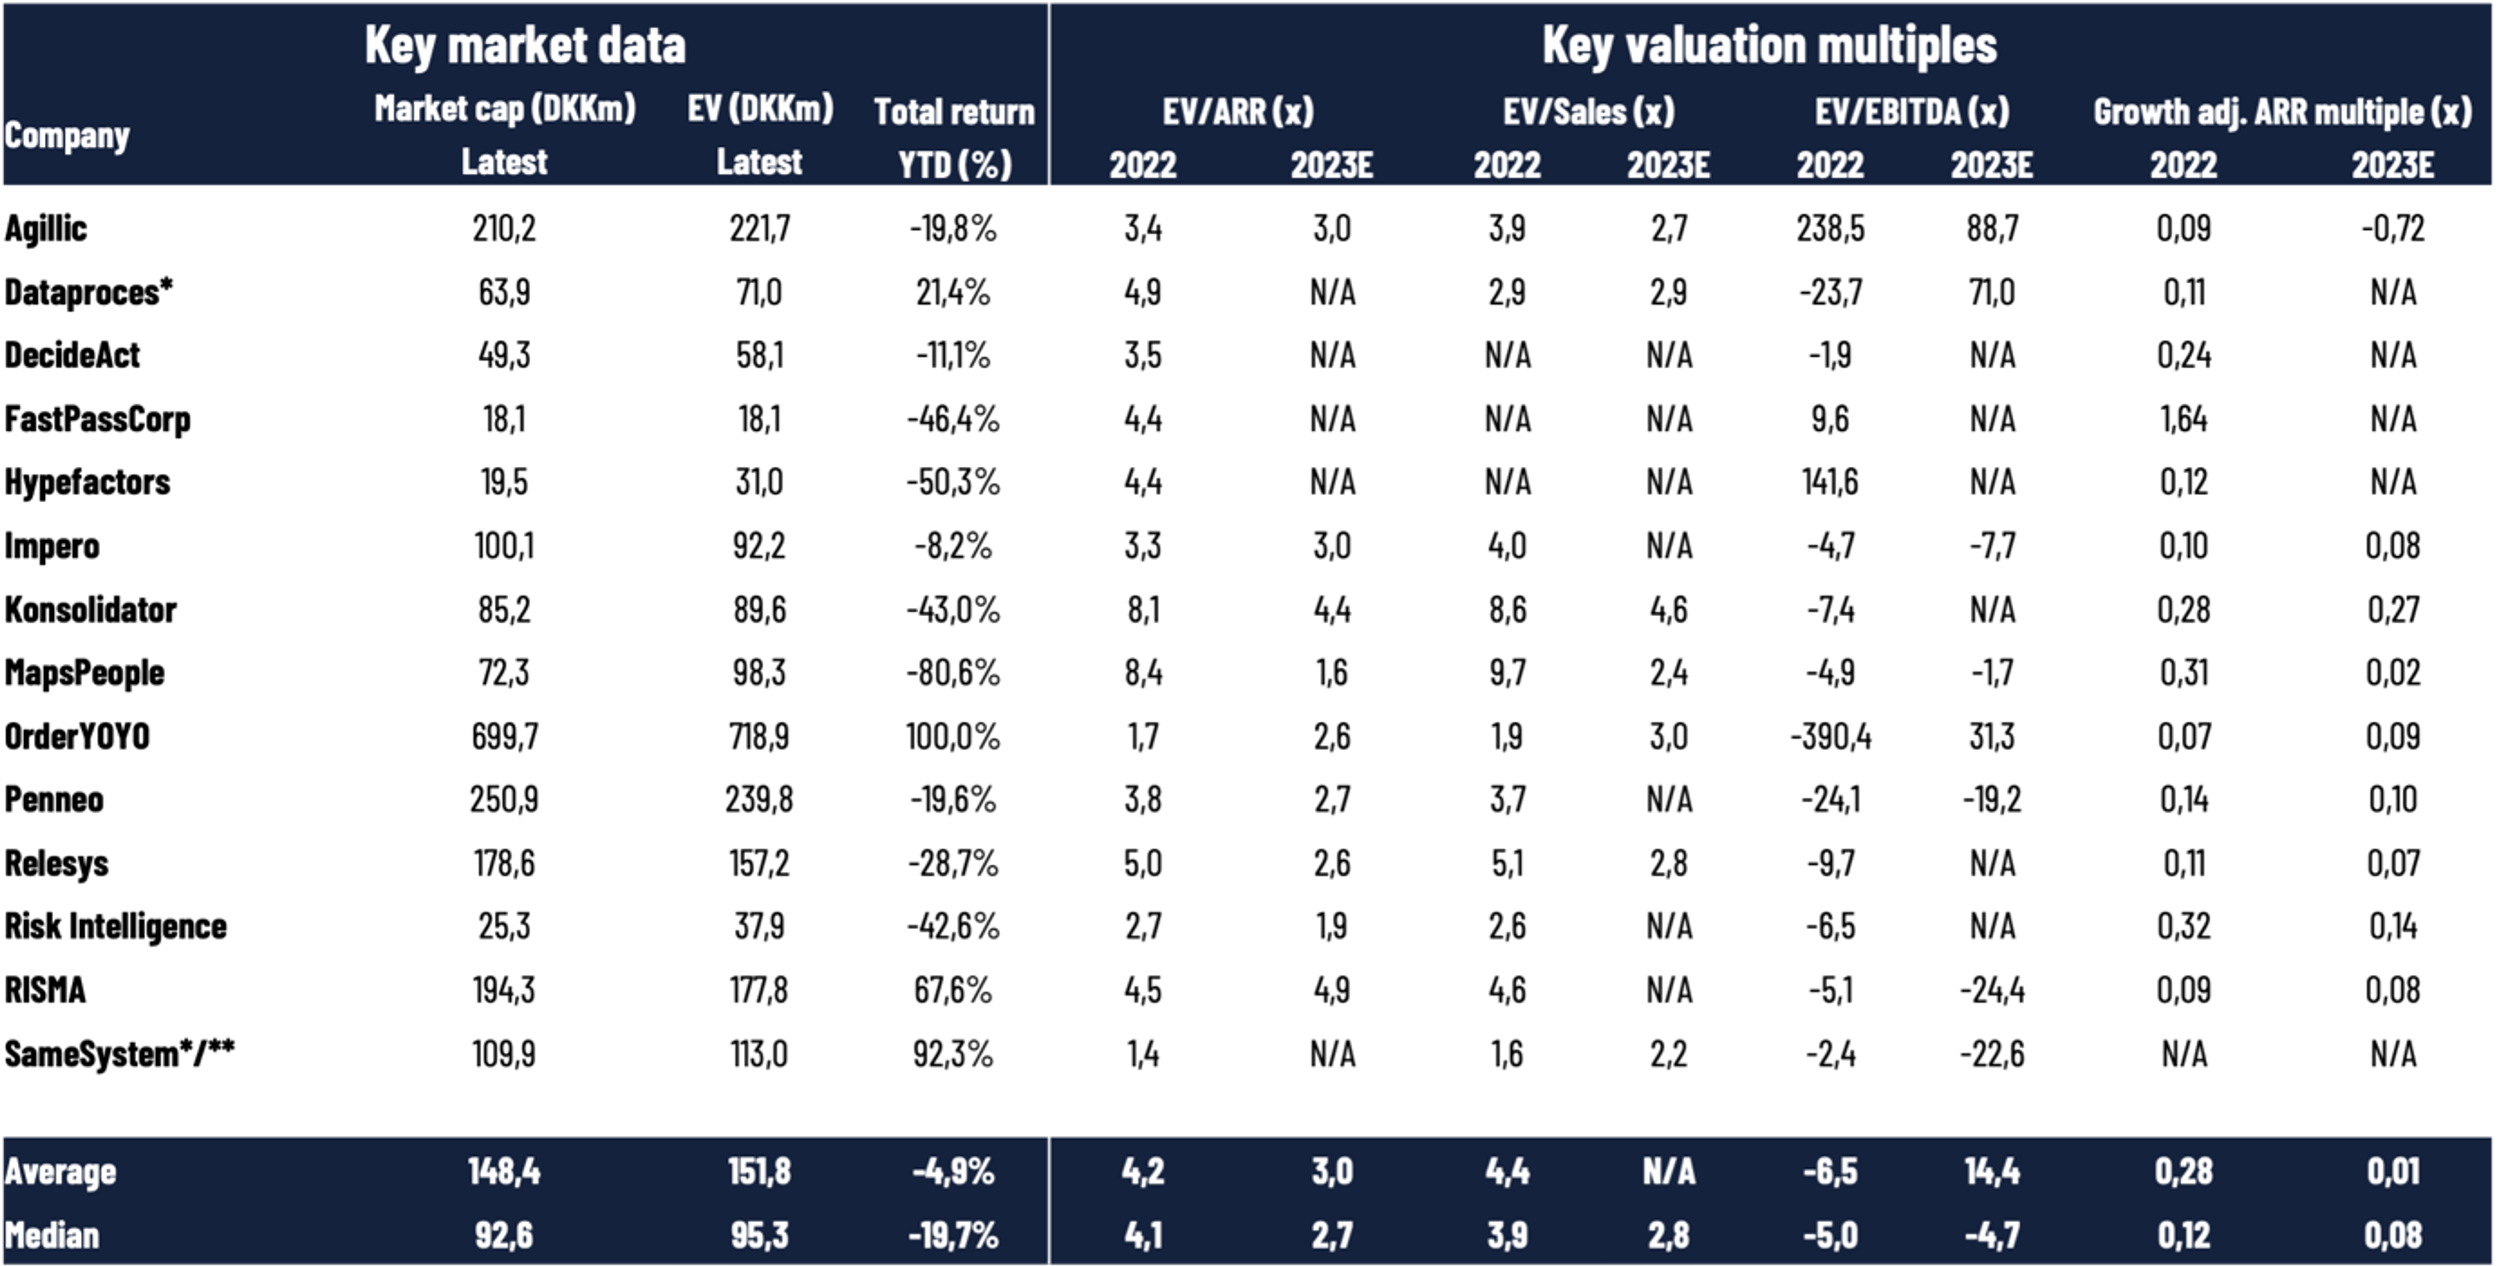

Note: The table above summarizes key market data, key valuation multiples, key SaaS metrics, and key financials for Danish-listed SaaS companies reporting ARR (some software companies such as cBrain do not include ARR in their reporting and are not included). *Some companies have different accounting periods (Dataproces and SameSystem), i.e., not a regular calendar year. We apply the companies’ reported SaaS metrics, however, there are differences in the reporting methodologies, as there are no regulations or standards yet. **SameSystem’s ARR methodology has been changed, and we apply the company’s reported Live ARR of DKK 47.6m as of 31 March 2023. Multiples for 2022 are based on market capitalizations from the end of 2022 and NIBD from the end of 2022 as well as reported financials collected from the annual reports of 2022. When applying 2023E for the companies, we are using the companies’ own guidance ranges (midpoint). We apply OrderYOYO’s pro forma net revenue in this overview (app smart consolidated full year) for both valuation multiples and growth rates. FCF/Net new ARR (2022) is calculated by taking FCF (cash flow from operations minus CAPEX, primarily investments in intangible assets) and the net ARR increase by the end of 2022 compared to the end of 2021. Penneo adjusts its FCF/Net new ARR ratio by DKK 2.4m due to costs related to the listing on the Main Market. Taking these costs out, the ratio will decline from -1.9x to -1.7x. In the calculation of net-interest-bearing debt (NIBD) for the companies in 2022, we have applied interest-bearing debt (including leasing liabilities) minus cash. This implies that negative values are companies with more cash than interest-bearing debt on their balance sheet by the end of 2022. We apply the latest reported NIBD (for most companies) and market capitalizations from 30 November 2023 in our calculations of Enterprise Value multiples for 2023E, implying that we have used the latest reported Q3 or H1 numbers for most companies. MapsPeople’s net revenue retention rate (NRR) is based on MapsIndoors. All data is collected manually from reports, and we cannot guarantee the correctness of all data. Source: HC Andersen Capital and company reports.
Appendix: We are fully aware that no SaaS companies have similar business models or similar reporting standards, as there are no regulated standards yet for SaaS metrics such as ARR, net revenue retention rate, etc. Nevertheless, we do not have any public information to align all metrics, implying that we must use the metrics reported by the companies in their annual reports. Consequently, our information and benchmark data should be assessed carefully before making any conclusions or decisions. That said, we are active in a working group that provides recommendations for how to measure and report the metrics to investors in the most appropriate way.
The HCA SaaS Index: Our HCA SaaS Index is inspired by the US-based The SaaS Capital Index, which tracks the median ARR (latest reported annualized current run-rate revenue) multiple across US-listed B2B software companies based on their market capitalizations by the end of the month. This implies that there are timing variations in the latest reported ARR, and the multiples do not account for differences in cash position and debt structure. Please be aware that the US-listed companies are typically significantly larger companies with a global presence than the companies that we are tracking in Denmark. Despite the ongoing focus on profitability as well as capital efficiency and not only growth, SaaS companies are still valued on a multiple of their ARR or revenue. Currently, this is the most relevant multiple to compare across the sector since most SaaS companies are not profitable yet.