During February 2024, the Danish SaaS sector (consisting of 13 SaaS companies’ stock prices) declined slightly with a median of approx. -3%. Combined with newer and higher reported ARR numbers from 2023 (we use latest reported ARR in the index), the median ARR multiple of the companies declined to 3.1x (from 3.3x ARR by end January 2024). Larger global US-listed SaaS companies also declined to a median of 6.6x ARR (from 6.9x ARR by end February 2024). Despite the decline in the ARR multiple in February and continued uncertainty, we observe some positive sentiment from the financial markets, also shown by an IPO window that is starting to open, driven by a stronger and stable stock market and continued market expectations of central banks lowering interest rates this year. The US 10Y bond yield has climbed a bit to above 4%, however, the latest top was approx. 5% in October 2023, and the growth stocks have not been concerned yet.
We also take a status on the reported 2023 numbers and, more importantly, how the outlook is for 2024. Without concluding too much, it still looks like the growth is challenged for many companies that are positioned in end markets with lower growth perspectives than what they have been used to. The earnings season is not over yet; however, the first impressions are that the 2024 outlook reflects either some pessimism or at least cautiousness.
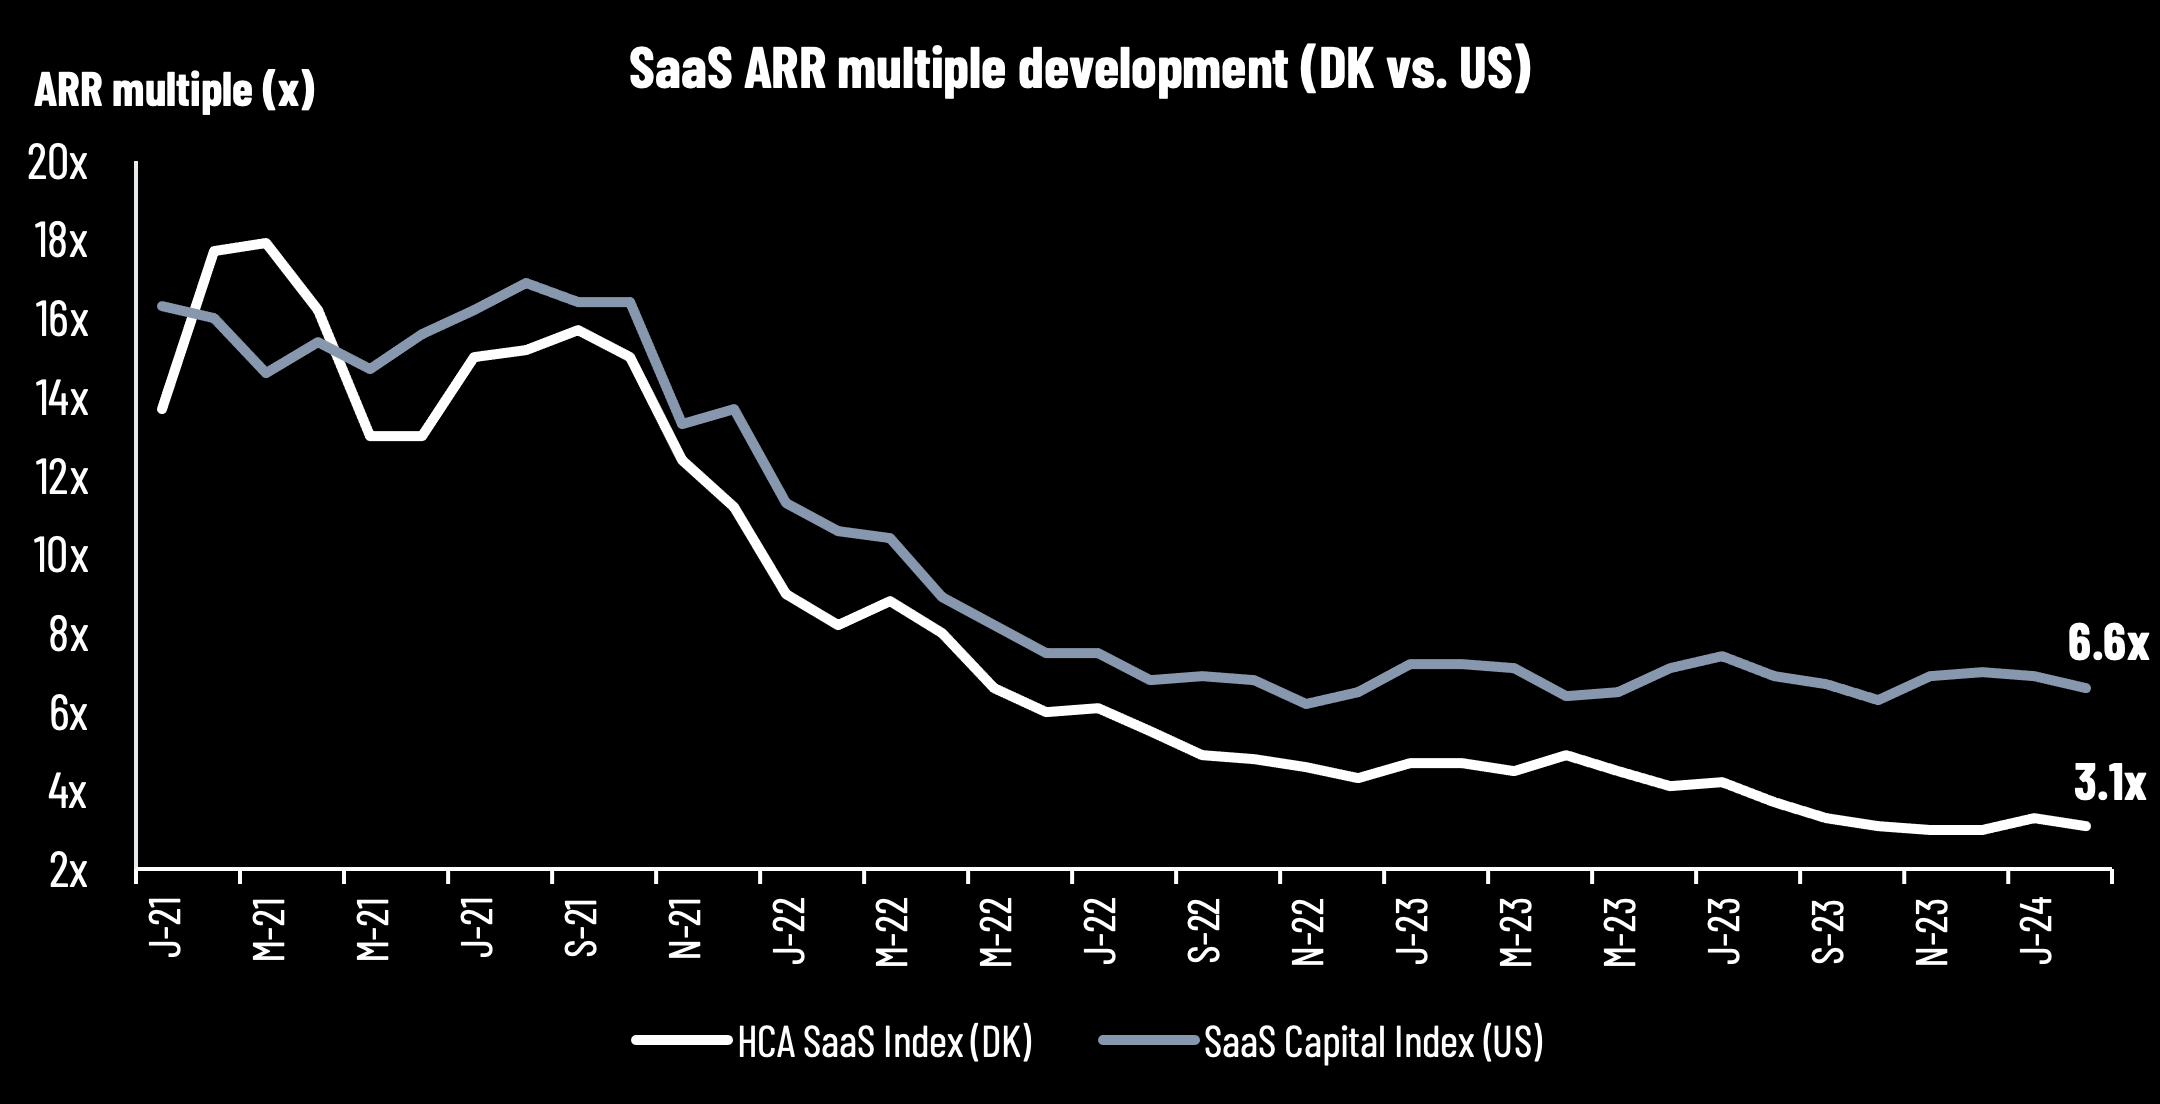
Source: HC Andersen Capital and The SaaS Capital Index
Reports from the Danish SaaS sector with 2024 outlook
In February, Agillic and Penneo were some of the companies that announced their annual report for 2023 and new 2024 guidance.
In 2023, Agillic’s ARR was hit by fewer transactions after being impacted negatively by geopolitical conflicts, macroeconomic uncertainty, and increasing SMS prices. The core business, ARR from subscriptions, increased by 7% YoY. EBITDA ended at DKK 1.9m in 2023 (DKK 1.1m in 2022). Looking into 2024, Agillic’s guidance range indicates a year that is somewhat similar to its 2023 results on both revenues, ARR, and EBITDA.
Penneo achieved 26% YoY ARR growth and EBITDA of DKK -8.7m in 2023, in line with its preliminary results and EBITDA guidance communicated in January. With the new 2024 EBITDA guidance in the range of DKK 5-10m, 2024 may be the first year for Penneo with positive EBITDA since 2019. In 2024, however, the growth rate is expected to be at a lower level of 18-25% YoY. Penneo also communicated that financial goals are expected to be communicated in the first half of 2024.
Even though investors are focusing on the balance between growth vs. profitability/cash flow (or at least a clear path to profitability), the growth rate is still the key driver. This is also backed by our latest newsletter focusing on the ‘Rule of X’ where there is a multiplier on the growth rate of 2-3x for public companies compared to the FCF margin based on research. Below, we have listed the ARR and EBITDA for 2023A (preliminary results or from audited 2023 reports) and 2024 guidance based on the midpoint of the ranges. The trend is clear; some ARR growth in 2024 is expected, but the largest delta is shown in the increase in profitability measured by EBITDA.

Note: The overview only includes companies with preliminary announced/audited results for 2023 and announced 2024 guidance (midpoint in guidance ranges). We use data until 12 March 2024. Konsolidator has no EBITDA guidance for 2024.
Source: HC Andersen Capital and company reports (manually collected).
Signs of more risk appetite despite mixed growth outlook
Many global US-listed SaaS companies have now reported their 2023 results and announced the full-year 2024 guidance. According to Clouded Judgement, the companies are not guiding above the current consensus (the median guide is 0.2% below consensus). The question is whether the companies are that pessimistic, or they are cautious and are guiding conservatively to make sure that they are not disappointing – and/or because the market is somewhat unclear to navigate in.
Despite the mixed 2024 guidance from listed global SaaS companies, there has been a somewhat increasing risk appetite for growth companies, especially all companies associated with AI. This is also supported by an IPO window that is starting to open. In combination, this may have a positive spillover effect on the whole SaaS sector. For the top 10 US-listed SaaS companies, the median EV/Sales (NTM) multiple is 16.5x compared to the overall median of 6.2x according to the Clouded Judgement newsletter by the end of February 2024. In relation to that, high-growth SaaS companies (>30% projected NTM growth) are traded at a median of 13.6x, showing that there are still high multiples for the highest-growing SaaS companies.
Overview of key metrics for Danish SaaS companies
We have collected data from 13 listed Danish SaaS companies. The overview will be updated on an ongoing basis. Market capitalizations are latest updated on 29 February 2024. Read the note below the tables for more detailed information.
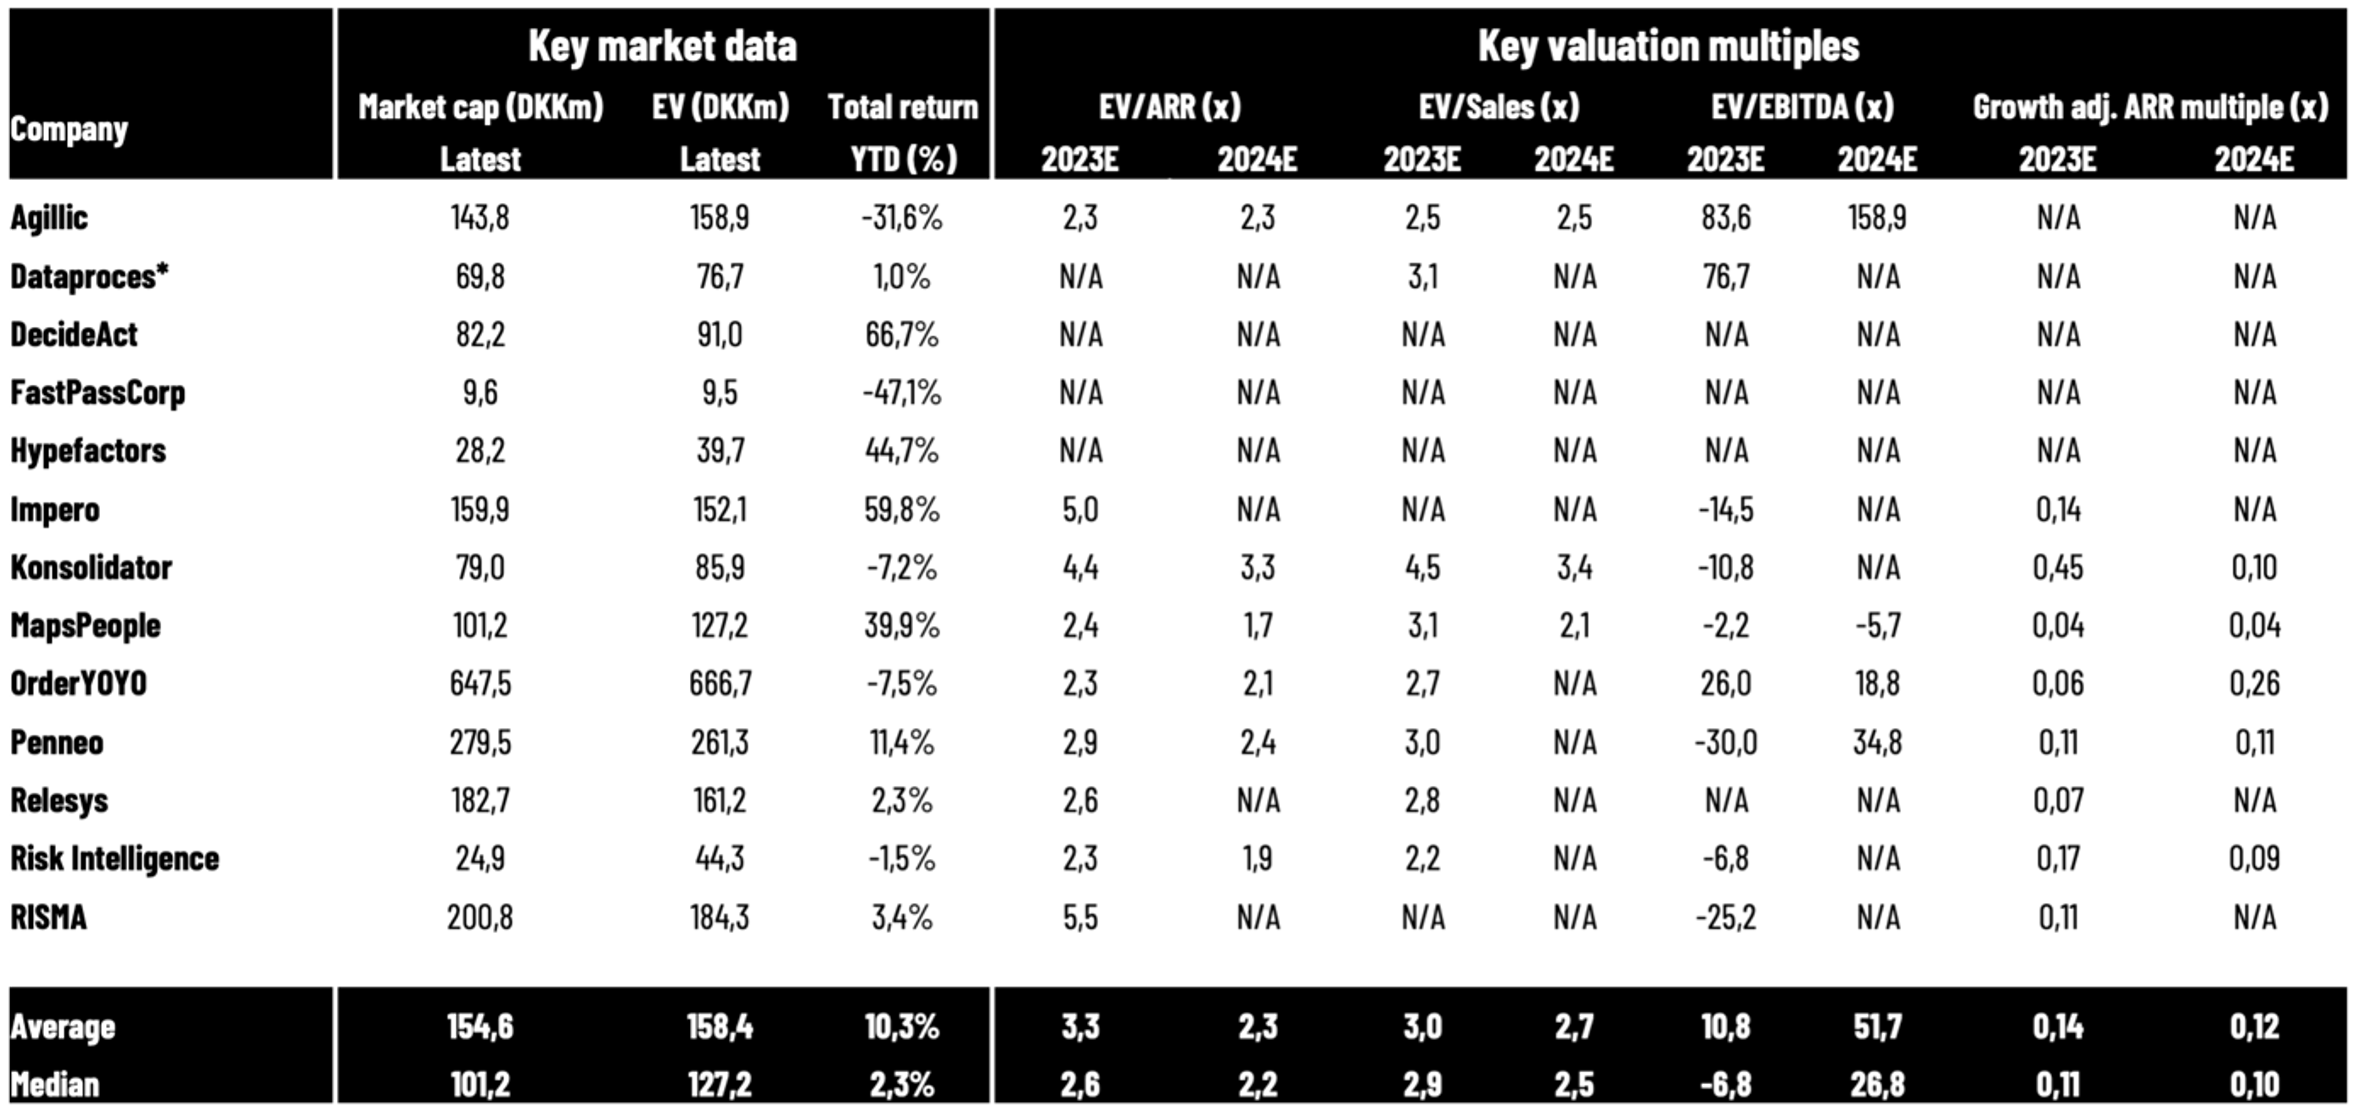
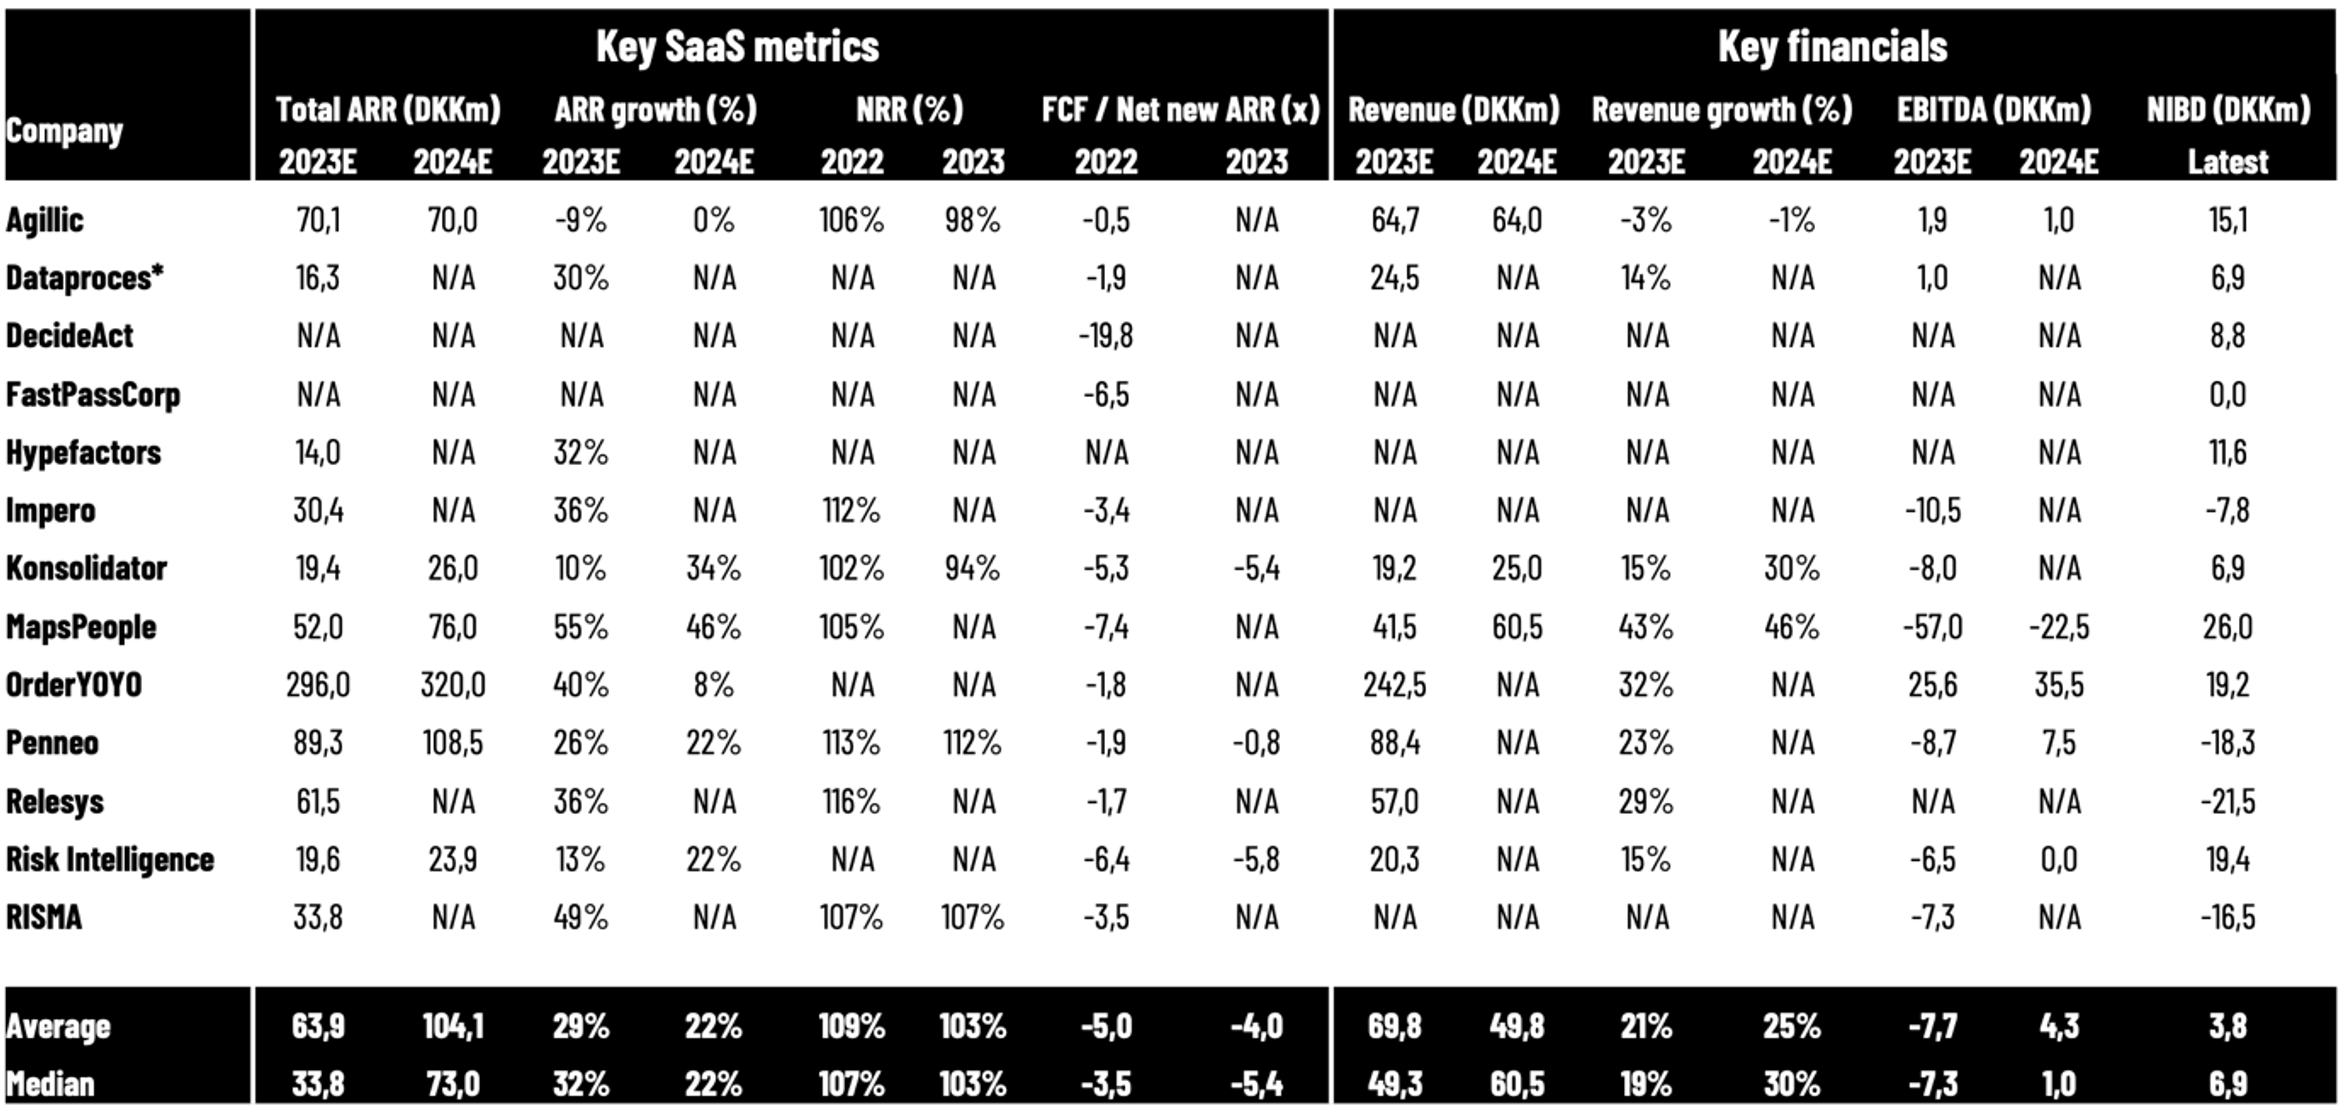
Note: The table above summarizes key market data, key valuation multiples, key SaaS metrics, and key financials for Danish-listed SaaS companies reporting ARR (some software companies such as cBrain do not include ARR in their reporting and are not included). *Dataproces has a skewed/different accounting period than a regular calendar year. We apply the companies’ reported SaaS metrics, however, there are differences in the reporting methodologies, as there are no regulations or standards yet. When applying 2023E and 2024E for the companies, we are using the companies’ guidance ranges (midpoint) or reported/preliminary 2023 numbers. We apply OrderYOYO’s pro forma net revenue in this overview (app smart consolidated full year) for both valuation multiples and growth rates. FCF/Net new ARR (2022) is calculated by taking FCF (cash flow from operations minus CAPEX, primarily investments in intangible assets) and the net ARR increase by the end of 2022 compared to the end of 2021. Penneo adjusts its FCF/Net new ARR ratio by DKK 2.4m due to costs related to the listing on the Main Market. Taking these costs out, the ratio will decline from -1.9x to -1.7x. In the calculation of net-interest-bearing debt (NIBD) for the companies in 2022, we have applied interest-bearing debt (including leasing liabilities) minus cash. This implies that negative values are companies with more cash than interest-bearing debt on their balance sheet by the end of 2022. We apply the latest reported NIBD (for most companies) and market capitalizations from 29 February 2024 in our calculations of Enterprise Value multiples for 2023E and 2024E, implying that we have used the latest reported numbers (2023 annual report, preliminary Q4 2023, Q3 2023, or H1 2023 numbers). MapsPeople’s net revenue retention rate (NRR) is based on MapsIndoors. All data is collected manually from reports, and we cannot guarantee the correctness of all data.
Source: HC Andersen Capital and company reports.
Appendix: We are fully aware that no SaaS companies have similar business models or similar reporting standards, as there are no regulated standards yet for SaaS metrics such as ARR, net revenue retention rate, etc. Nevertheless, we do not have any public information to align all metrics, implying that we must use the metrics reported by the companies in their annual reports. Consequently, our information and benchmark data should be assessed carefully before making any conclusions or decisions. That said, we are active in a working group that provides recommendations for how to measure and report the metrics to investors in the most appropriate way.
The HCA SaaS Index: Our HCA SaaS Index is inspired by the US-based The SaaS Capital Index, which tracks the median ARR (latest reported annualized current run-rate revenue) multiple across US-listed B2B software companies based on their market capitalizations by the end of the month. This implies that there are timing variations in the latest reported ARR, and the multiples do not account for differences in cash position and debt structure. Please be aware that the US-listed companies are typically significantly larger companies with a global presence than the companies that we are tracking in Denmark. Despite the ongoing focus on profitability as well as capital efficiency and not only growth, SaaS companies are still valued on a multiple of their ARR or revenue. Currently, this is the most relevant multiple to compare across the sector since most SaaS companies are not profitable yet.
Disclaimer: HC Andersen Capital receives payment from some of the mentioned SaaS companies (Agillic, Impero, MapsPeople, OrderYOYO, and Penneo) for a Digital IR/Corporate Visibility subscription agreement. All content in this newsletter is only for informational purposes. HC Andersen Capital cannot guarantee the correctness of all data in this newsletter.