Source: HC Andersen Capital and The SaaS Capital Index
Key takes from the Danish SaaS Q1 earnings season
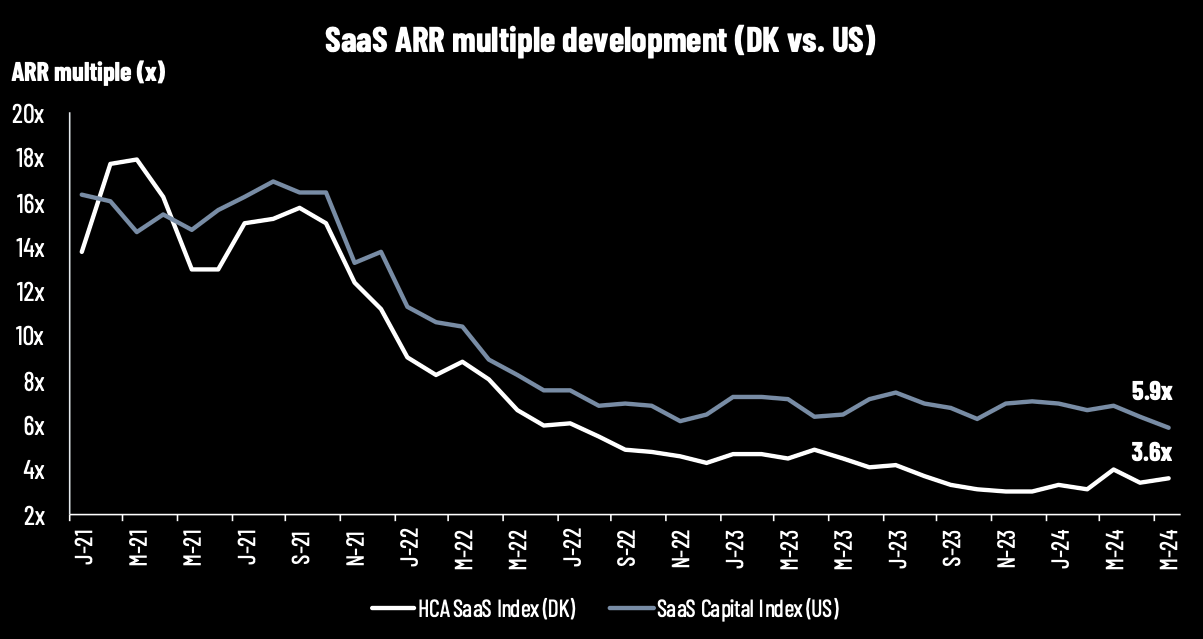
On the back of the Q1 reports from the Danish SaaS sector, we saw that the ARR growth (YoY) declined to a median of 28% in Q1 2024 (across 7 selected Danish-listed SaaS companies) from 34% in Q4 2023, 38% in Q3 2023, 33% in Q2 2023, and 35% in Q1 2023. Median net new ARR (QoQ) was only DKK 1.8m in Q1 2024, also below DKK 2.2m in Q4 2023, DKK 3.3m in Q3 2023, DKK 4.9m in Q2 2023, and DKK 2.6m in Q1 2023. Nevertheless, the Danish SaaS sector median ARR multiple (latest reported) did relatively well and ended at 3.6x by the end of May 2024 (from 3.4x ARR by the end of April 2024).
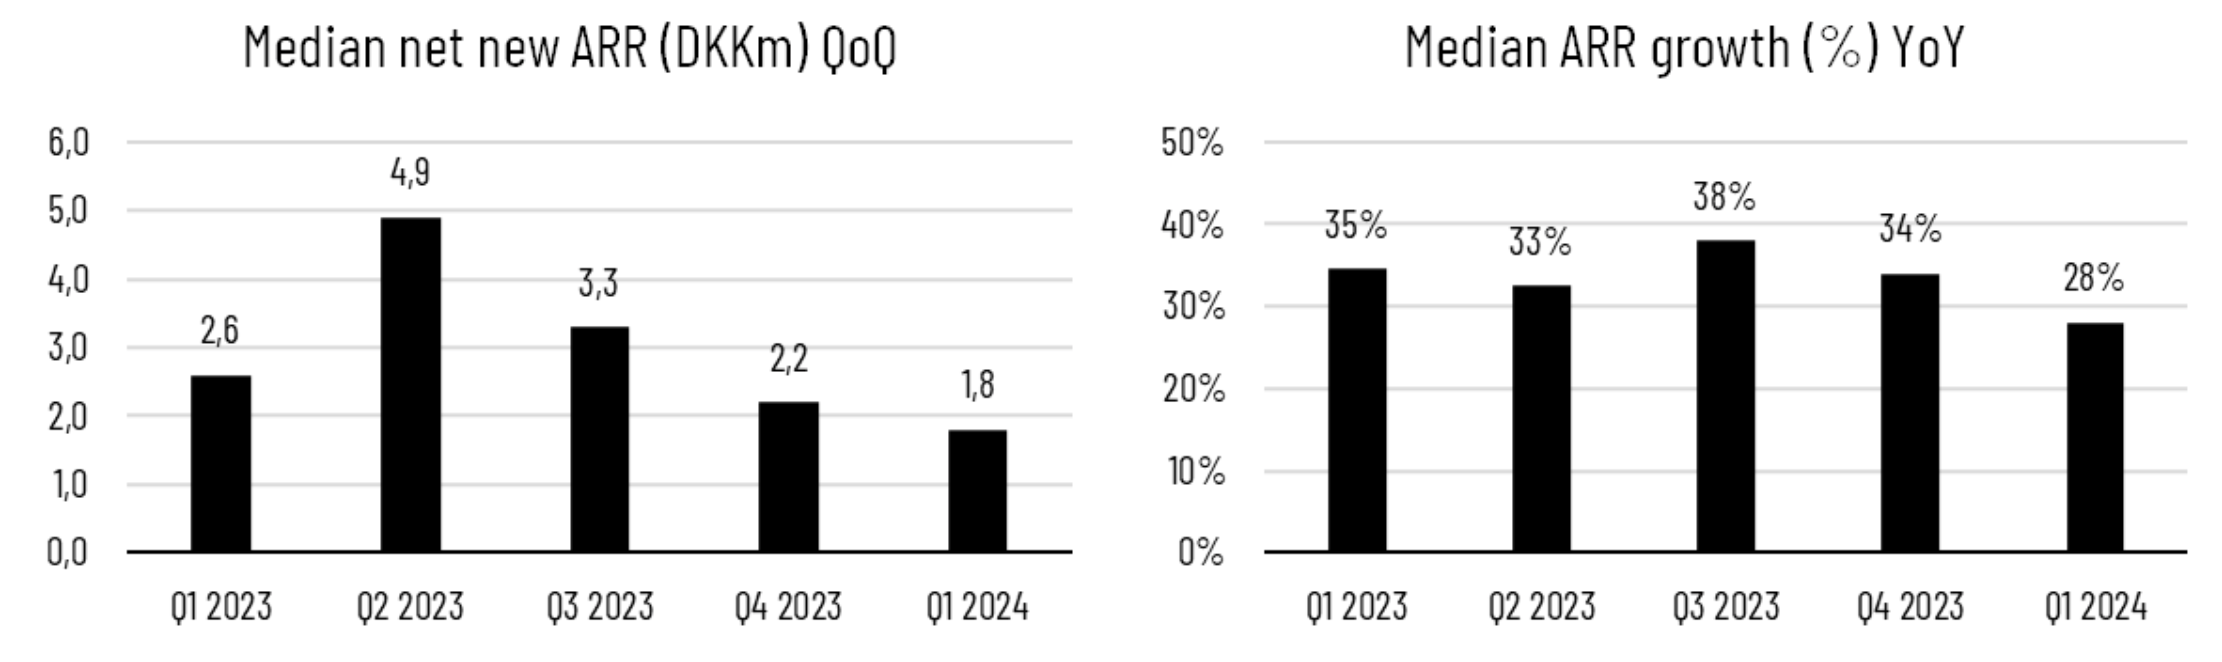
Source: HC Andersen Capital and company reports. Median is calculated across the following companies: Agillic, Impero, Konsolidator, MapsPeople, OrderYOYO, Penneo, and RISMA.
Looking at profitability measured by EBITDA, the Danish SaaS-listed companies improved their EBITDA results almost across the board, supporting the ongoing shift towards profitability and increased focus on cash flow. This was also underlined by some of the recent Q1 financial reports from Penneo, Impero, and MapsPeople which were announced in May. In Q1 2024, Penneo improved EBITDA to DKK -3.7m (DKK -6.6m in Q1 2023), Impero improved its EBITDA to DKK -2.0m (DKK -3.6m in Q1 2023), and MapsPeople improved its EBITDA to DKK -8.5m (DKK -16.7m in Q1 2023). However, we must remember that growth is still the key value driver for the Danish-listed SaaS companies.
Low global software sentiment after weak Q1 results and outlook for Q2
As Q1 results (based on global/US companies reporting Q1 ending 30 April, i.e. skewed quarter) have been poor across the largest software companies with almost 70% of software companies guiding Q2 below consensus, the sector declined significantly in May. Large SaaS companies such as Salesforce and UiPath were down approx. -20% and -34%, respectively after their Q1 reports. Other major software stocks such as ServiceNow (-12%), Cloudflare (-10%), and Crowdstrike (-10%) also declined significantly.
In Q1, UiPath saw increased deal scrutiny and lengthening sales cycles for large multi-year deals, and the company’s now former CEO Robert Enslin was replaced by UiPath’s co-founder Daniel Dines (from co-CEO to now sole CEO). In line with UiPath’s comments, Salesforce warned about budget scrutiny, longer deal cycles, deal compression, and slowing projects.
Clouded Judgement (Jamin Ball) unfolds some of the reasons for the weakness in the software sector:
First, growth momentum from Q4 2023 did not continue into the beginning of 2024, and analyst estimates came down and not up. Thus, the re-acceleration of growth has not been seen due to prolonged sales cycles from low sentiment, yet company expectations are still that increasing growth will happen in the second half of 2024.
Second, most of the expected growth from AI has not shown up yet in the SaaS sector, which is in line with the concerns we highlighted in our SaaS sector report, which you can read here: https://www.inderes.dk/research/software-as-a-service-sector-report-spring-2024-will-the-early-signs-of-tailwinds-continue. We almost only see it in the large hyperscalers (AWS, Google Cloud, and Microsoft Azure), and investors still wait to see positive AI effects across the SaaS sector. Referring back to our findings from the sector report, we can see that the early signs of tailwinds were not confirmed in the Q1 reports. In relation to this, an explanation could also be that AI investments (outside the software sector) take the IT budgets away from new software investments.
Third, interest rates have challenged the valuation environment for growth such as in the SaaS sector. Expectations of rate cuts in the US, which will be positive for software valuations, have changed from several expected rate cuts to maybe only one or even none in 2024. In late May, the US 10Y bond yield topped at 4.6%, yet recent news cooled it off, implying that the US 10Y bond yield is back at 4.3%, still above the level of below 4% at the beginning of the year.
Overview of key metrics for Danish SaaS companies
We have collected data from 11 listed Danish SaaS companies. The overview will be updated on an ongoing basis. Market capitalizations are latest updated on 31 May 2024. Read the note below the tables for more detailed information.
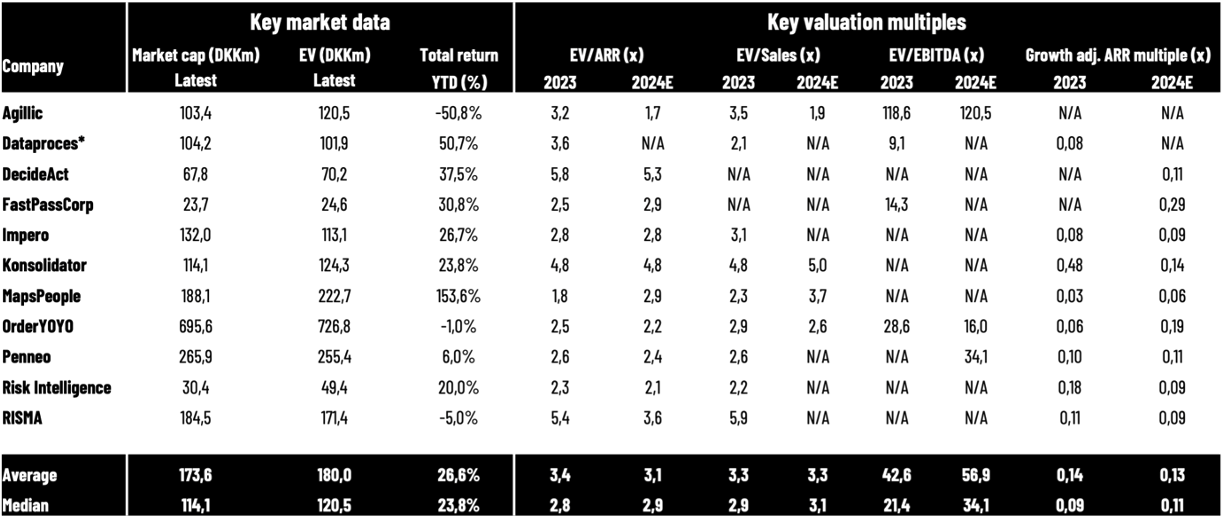
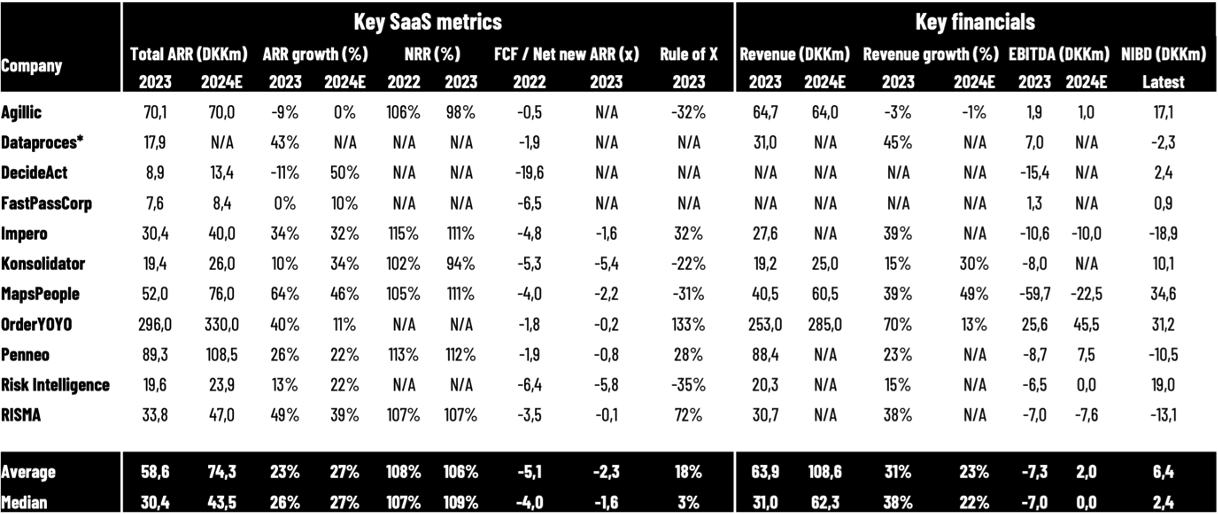
Note: The table above summarizes key market data, key valuation multiples, key SaaS metrics, and key financials for Danish-listed SaaS companies reporting ARR (some software companies such as cBrain do not include ARR in their reporting and are not included). *Dataproces has a skewed/different accounting period than a regular calendar year. We apply the companies’ reported SaaS metrics, however, there are differences in the reporting methodologies, as there are no regulations or standards yet. When applying 2024E for the companies, we are using the companies’ guidance ranges (midpoint). We apply OrderYOYO’s pro forma net revenue in this overview (app smart consolidated full year) for both valuation multiples and growth rates. FCF/Net new ARR (2022) is calculated by taking FCF (cash flow from operations minus CAPEX, primarily investments in intangible assets) and the net ARR increase by the end of 2022 compared to the end of 2021. Penneo adjusts its FCF/Net new ARR ratio by DKK 2.4m due to costs related to the listing on the Main Market. Taking these costs out, the ratio will decline from -1.9x to -1.7x. In the calculation of net-interest-bearing debt (NIBD) for the companies in 2022, we have applied interest-bearing debt (including leasing liabilities) minus cash. This implies that negative values are companies with more cash than interest-bearing debt on their balance sheet. We apply the latest reported NIBD (for most companies) and market capitalizations from 31 December 2023 in our calculations of Enterprise Value multiples for 2023, and market capitalizations from 31 May 2024 for 2024E. MapsPeople’s net revenue retention rate (NRR) is based on MapsIndoors. All data is collected manually from reports, and we cannot guarantee the correctness of all data. Source: HC Andersen Capital and company reports.
Appendix: We are fully aware that no SaaS companies have similar business models or similar reporting standards, as there are no regulated standards yet for SaaS metrics such as ARR, net revenue retention rate, etc. Nevertheless, we do not have any public information to align all metrics, implying that we must use the metrics reported by the companies in their annual reports. Consequently, our information and benchmark data should be assessed carefully before making any conclusions or decisions. That said, we are active in a working group that provides recommendations for how to measure and report the metrics to investors in the most appropriate way.
The HCA SaaS Index: Our HCA SaaS Index is inspired by the US-based The SaaS Capital Index, which tracks the median ARR (latest reported annualized current run-rate revenue) multiple across US-listed B2B software companies based on their market capitalizations by the end of the month. This implies that there are timing variations in the latest reported ARR, and the multiples do not account for differences in cash position and debt structure. Please be aware that the US-listed companies are typically significantly larger companies with a global presence than the companies that we are tracking in Denmark. Despite the ongoing focus on profitability as well as capital efficiency and not only growth, SaaS companies are still valued on a multiple of their ARR or revenue. Currently, this is the most relevant multiple to compare across the sector since most SaaS companies are not profitable yet.