Focus on 2023 guidance and the growth picture
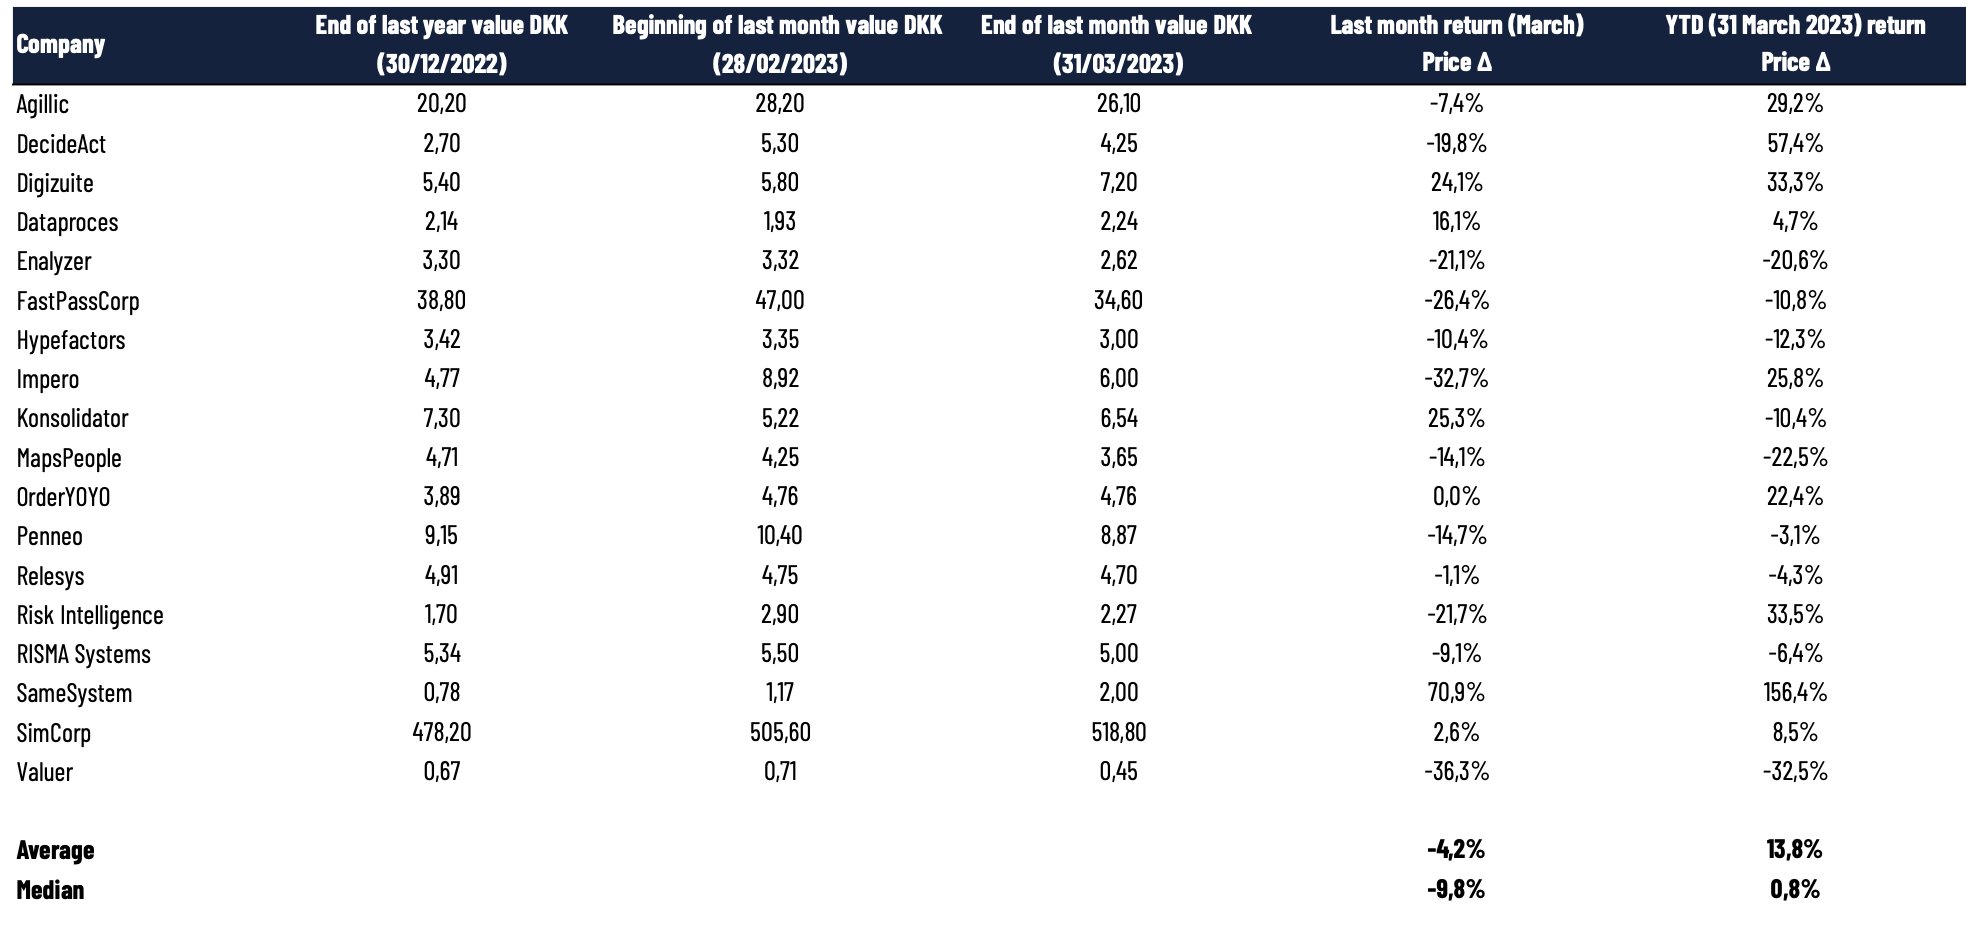
Our HCA SaaS ARR Multiple Index, measured on a simple median ARR multiple across the Danish SaaS sector, declined slightly to 4.5x ARR by the end of March (from 4.7x ARR end of February). See appendix for methodology. Looking at the market-value weighted share price performance across the sector, we also observed a share price decline to index 17.2 (from index 19.7 end of February) based on the index’s beginning in 2021.
For perspective, the larger and more liquid US-listed SaaS companies – measured by The SaaS Capital Index (annualized current run-rate revenue) – also decreased slightly to 7.1x ARR by the end of March 2023 (from 7.2x ARR by the end of February 2023). This could somewhat be explained by the construction of the index (P/ARR), where the increase in the denominator (latest reported ARR with new higher numbers) increased more than the numerator (share prices).
Despite the declines in the valuation multiples, the US 10Y bond yield declined to 3.47% by the end of March (from 3.93% by the end of February), which should have a positive effect on the SaaS valuations. This could mean that investors are starting to position themselves to benefit from the lower interest rate environment if growth rates begin to pick up during 2023. This was somewhat also observed in the larger technology companies, as the NASDAQ index increased nearly 5% during March, which may have a lagging effect on the smaller growth companies. Looking into the Q1 2023 reporting season, this will be where the rubber meets the road on the more positive sentiment from the lower interest rate. The question is how investors will react to results that are expected to show lower growth compared to the last couple of years, although a conservative Q1 guidance may provide a little protection.
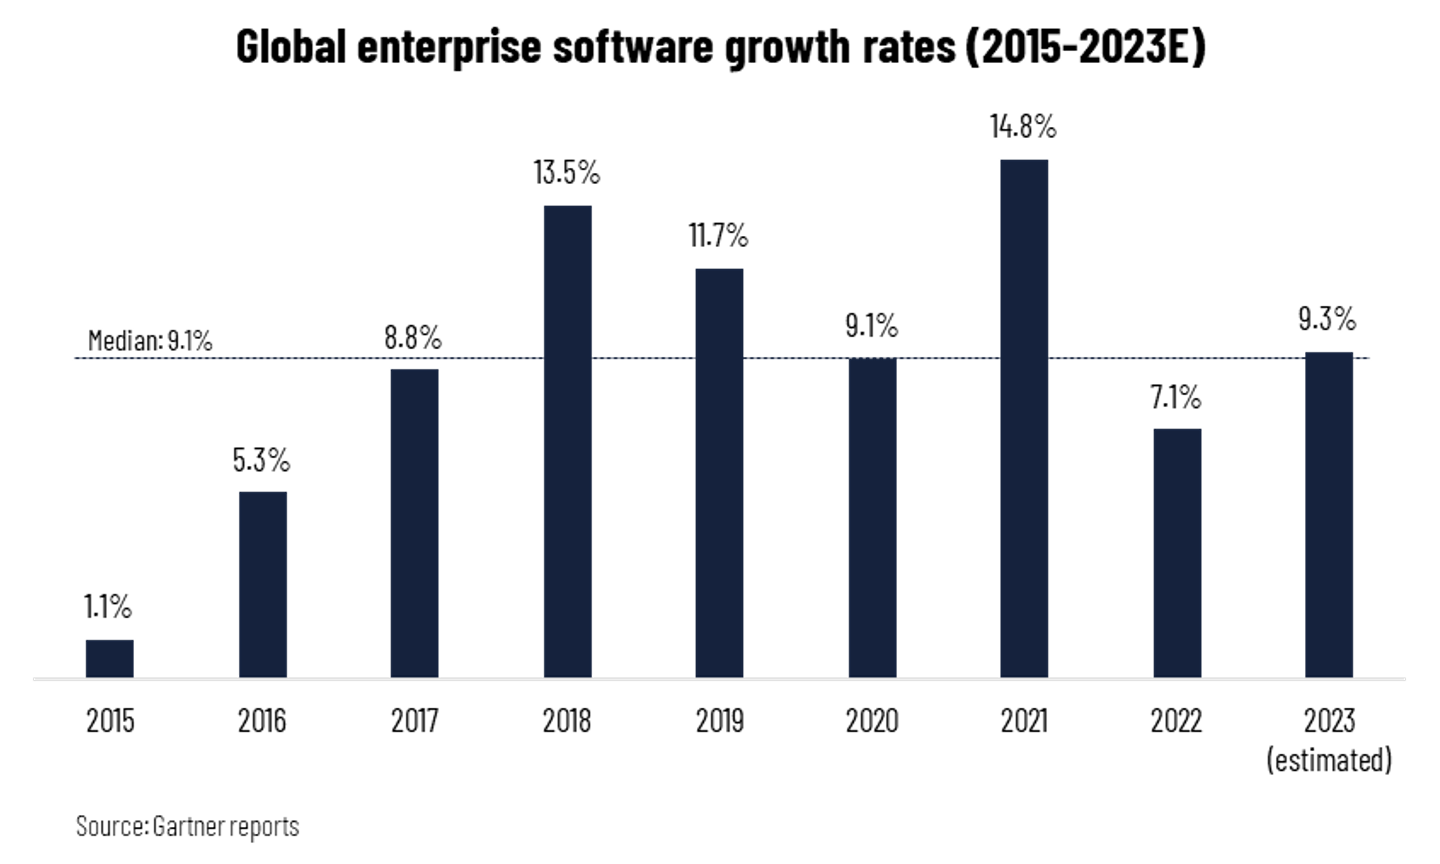
Gartner estimates higher software market growth in 2023 compared to 2022
Focusing on the expected software growth rates for 2023, a leading market research firm, Gartner, estimates that the global software market will increase by 9.3% in 2023, up from 7.1% in 2022, however, significantly lower than the peak level of 14.8% in 2021 following COVID-19 and the accelerated digital transformation. As shown in the graph below, this is somewhat close to the median growth rate (9.1%) from 2015 to 2023E.
Despite management comments about continued prolonged sales cycles or changes in the buyers decision-making process, the expected software sector growth supports that 2023 may be better than 2022 on an overall level, however, it is potentially back-end loaded, since Q1 2023 based on expectations from global US-listed companies were weaker than analyst consensus according to Jamin Ball (Clouded Judgement newsletter, 24 March 2023).
According to a new CIO survey from Morgan Stanley, there are also signs of more stabilization of IT budgets compared to the end of 2022 when looking at CIOs and their IT budgets. There is a small increase in the percentage of CIOs who are expecting to increase their IT budgets. However, on the other hand, there is still the same percentage of CIOs, similar to the Q4 2022 end survey, who expect to decrease their IT budgets, meaning that it is too soon to conclude anything from the numbers in the survey.
2023 guidance points to slightly higher growth in the Danish SaaS sector
Looking into the Danish SaaS sector, we also see that there is slightly more confidence when looking into 2023 compared to 2022. Now, most Danish-listed SaaS companies have reported their 2022 results and provided their guidance for 2023. We observe that the midrange ARR guidance for 2023 of 32% exceeds the realized ARR 2022 growth rate of 29% (only comparing companies that have reported 2022 ARR and expected 2023 ARR). At the same time, we also see that the companies are having a larger focus on capital efficiency and profitability (median EBITDA guidance for 2023 is better than the realized 2022 EBITDA result). We expect to have a full overview of the listed SaaS companies in our next newsletter for May.
Appendix
As several Danish SaaS companies have been listed on the Danish stock market over the past years, we have seen an increasing interest in benchmark data and insights into the recent development of SaaS metrics and multiples as well as news from the space.
We are fully aware that no SaaS companies have similar business models or similar reporting standards, as there are no regulated standards yet for SaaS metrics such as ARR, net revenue retention rate, churn rate, etc. Nevertheless, we do not have any public information to align all metrics, implying that we must use the metrics reported by the companies in their annual reports. Consequently, our information and benchmark data should be assessed carefully before taking any conclusions or decisions. That being said, we are active in a working group that provides recommendations for how to measure and report the metrics to investors in the most appropriate way.
The HCA SaaS Index: Our HCA SaaS Index is inspired by the US-based The SaaS Capital Index, which tracks the median ARR (latest reported annualized current run-rate revenue) multiple across US-listed B2B software companies based on their market capitalizations by the end of the month. This implies that there are timing variations in the latest reported ARR, and the multiples do not account for differences in cash position and debt structure. Please be aware that the US-listed companies are typically significantly larger companies with a global presence than the companies that we are tracking in Denmark. Despite the ongoing focus on profitability as well as cash positions and not only growth in SaaS companies, SaaS companies are still valued on a multiple of their ARR or revenue. Currently, this is the most relevant multiple to compare across the sector, since most SaaS companies are not profitable yet.
Our index currently consists of the following 18 companies below which have reported their recent annual report for 2022 or lately. As mentioned in the introduction, we will provide more benchmark data with data tables going forward.
Specifically, we are calculating the market capitalizations for 18 Danish-listed SaaS companies by the end of each month. We divide each company’s market capitalization by their latest reported ARR (which may differ between the companies). Based on all the multiples, we calculate the median value for our index. All companies have been tracked for at least a year (the latest SaaS IPO in Denmark was in December 2021). This has not caused any considerable differences in the historical numbers of the ARR multiple, since we are using the median value. We do not track the median before 2021 as the index consisted of relatively few companies reporting ARR, and many SaaS IPOs were during 2021.
The HCA SaaS Share Price: Our “HCA SaaS Share Price” shows the share price development weighted by the market value of an index of Danish SaaS companies that reports ARR. SimCorp is excluded as the company outweighs the sector with its market value of more than DKK 20 billion. Data for the index is provided by Refinitiv.
Disclaimer: HC Andersen Capital receives payment from some of the mentioned SaaS companies (Agillic, Impero, MapsPeople, OrderYOYO, and Penneo) for a Digital IR/Corporate Visibility subscription agreement.