
Discounting potential in individual BioTech and Life Science companies
Most BioTech and Life Science companies in their developing phases still only have little or no sales, profits and cash flow generation which means that there are no traditional stock related valuation multiples available to get valuation perspectives on individual BioTech and Life Science company. As regular readers of the BioSnack know, instead we use a Discounted Cash Flow (DCF) based modelling approach in our One-Pagers to get valuation perspective.
The inputs to the DCF model are primarily ‘company guided’ which means inputs are taken from public available information provided by the company through its financial reports, press releases, presentations etc. to reflect future expected levels of market sizes, markets growth, market share, cost level, royalty rates, patent expiry periods etc. related to each product candidate in the pipeline etc. If not provided or guided by the company, we would for modelling purposes use historical averages at the BioTech and Life Science sector level provided third party data providers as inputs to the model.
Once the DCF model has these inputs, this company guided model can be compared to market capitalization of the company to get a sense of how much of the value of the BioTech and Life Science company’s pipeline is discounted by investors in the market. The measure of this discounted value is reflected in the Probability of Success (PoS). As an example, in this edition of the BioSnack, the market implied PoS of Curasight’s most advanced parts of its pipeline (phase 2) is approximately 15 percent. This means that the market implicitly only discounts 15 percent likelihood that Curasight will be successful in getting their products approved and commercialized as projected and guided by the company. In other words, only 15 percent of expected value of Curasight’s expected future sales and profits is currently discounted by the market. This can be compared to the historical average of successful approval rates for phase 2 pipeline projects in the BioTech and Life Science sector according to Biostatistic, which is 55 percent, or more than 3 times the PoS for Curasight. So currently, the market has very little confidence in Curasight will get its product successfully approved and commercialized – both in absolute terms and relative to the historical average for the sector.
There are reservations to the comparison, however. Firstly, a low market implied PoS can reflect that the market implicitly assumes that the BioTech and Life Science in question – i.e. Curasight – will have to raise capital that will dilute the share base. In some cases, this can have a huge explanatory effect of a low PoS. Secondly, historical sector averages are ex-post calculated values that has no potential future diluting capital raise to account for. So PoS and historical average approval rates are not fully comparable and should be used with caution.
Even with reservations, the PoS measure can give investors some useful valuation perspectives to consider; if the market implied PoS is low – both in absolute and relative terms – and the BioTech and Life Science company in question is sufficiently funded and the investor expects the company to be at least as likely as BioTech and Life Science companies on average to succeed, then there can be a multiple appreciation potential to consider. In the case of Curasight as an example, an approximately 3 times multiple if Curasight does not have to raise diluting capital and are expected to have average likelihood to succeed, and an even higher 6-7 times multiple if the investor believe they will succeed with certainty and have sufficient funding.
Just as the BioTech and Life Science indices has moved up and down, we have seen the PoS of the individual companies to move up and down and be at completely different levels. Any generalisation of the level of PoS in individual BioTech and Life Science companies should be made with caution as there are individual factors to consider in each case. As we continue to build our modelling database of BioTech and Life Science companies, we expect to have enough PoS’ available in the future to be able to make more generalizing remarks based on individual PoS’. At this point, based on the – still limited number of – PoS’ in our database, they generally do indicate a lower-than-normal level of PoS on a case-by-case basis.
Discounting potential in BioTech and Life Science companies on aggregate
To get an idea of the overall valuation level of BioTech and Life Science stocks in general, we look at aggregate market capitalization of BioTech and Life Science stocks measured relative to the aggregate market capitalization of the overall market. There are certainly theoretical and practical shortcomings to this approach, but as there are no traditional valuation multiples available, we simply use this measure as an indication as to how much is discounted, i.e. how favourably investors look at BioTech and Life Science stocks relative to other stocks. This sentiment or discounting indicator can be compared to usage of traditional valuation multiples measured relative to each other. As an example: If a sector on average (historically) trades on a 20 percent premium on P/E versus the market, when the premium is 40 percent, investors expect (i.e. discounts) a lot, and when the sector trade on par with the market with no premium, the sector discounts less. In neither example does the relative premium relative to history offer a future predictive return value in absolute terms, but it indicates how much is discounted, i.e. how expensive investors perceive the sector to be.
Used as a discounting indicator, the interpretation is simple; if the relative value is high, investors in BioTech and Life Science stocks discounts a high future potential value in a historical context, and if it is low, investors discount a low potential value. Again, as the discounting indicator is a relative measure, even when the indicator is above the historical average, it can not be used as an absolute future return predictive measure. If the general market moves up, and the indicator is very high – but stable – the absolute return can still be positive etc.
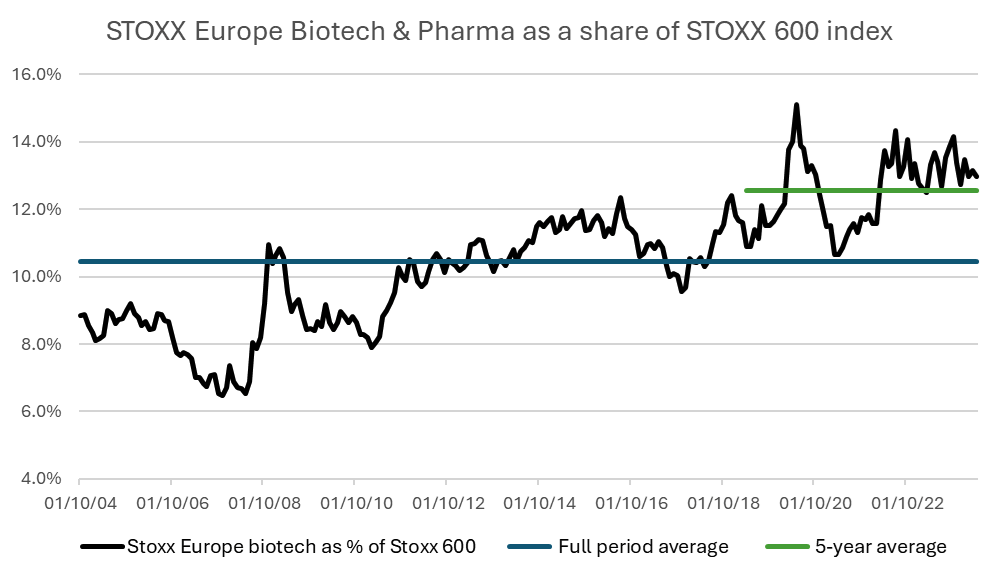
Using Stoxx indices and relative market capitalization as a proxy, exhibit x shows that investors on a longer-term basis has increased their expectation for BioTech and Life Science stocks relative to the market. Among other things, a specific reservation should be made regarding the individual companies that is included in the indices. Within BioTech and Life Science indices, these companies change over time. Bearing this in mind, the exhibit shows that for a more appropriate time horizon of the last 5 years, although up strongly the last 6 months, investors still only discount an average relative value in BioTech and Life Science stocks when compared to the overall stock market.
To summarize, Biotech and Life Science indices has outperformed markedly the last 6 months but from a relative perspective, investors still seem to discount only a lower than historical average likelihood of success for some individual BioTech and Life Science companies or an average potential value of the BioTech and Life Science sector versus the market at the aggregate level.